 CloudConsole
aws cloudwatch put-metric-data
aws cloudwatch put-metric-data --namespace MyApp --metric-name QueueLag --value 42 --unit Seconds --dimensions Environment=prod publishes one datapoint to a custom metric. The metric appears within a few minutes and can then be graphed and alarmed on like any AWS metric; every unique name and dimension combination is billed as a separate custom metric.
What the command does
Custom metrics let you alarm on anything you can measure: backlog size from a cron job, the age of the latest backup, disk usage reported by a script, business events. The CLI offers two styles: single-datapoint options (--metric-name, --value, --unit, --dimensions, --timestamp) and --metric-data, which takes a JSON list for batches.
Syntax
aws cloudwatch put-metric-data --namespace MyApp \
  --metric-name BackupAgeHours --value 3.5 --unit None \
  [--dimensions Database=orders,Environment=prod] \
  [--timestamp 2026-11-16T09:00:00Z] \
  [--storage-resolution 1]

aws cloudwatch put-metric-data --namespace MyApp --metric-data file://metrics.json
In the single-datapoint form, --dimensions uses Name=Value pairs separated by commas.
Worked examples
Report a queue backlog from a cron job every minute:
LAG=$(psql -tAc "select extract(epoch from now() - min(created_at)) from jobs where done = false")
aws cloudwatch put-metric-data --namespace MyApp --metric-name JobBacklogSeconds \
  --value "${LAG:-0}" --unit Seconds --dimensions Environment=prod
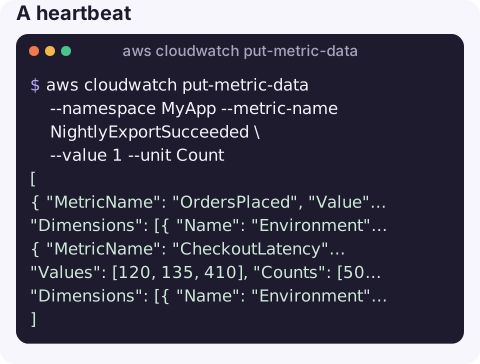
A heartbeat for a job that should run nightly, paired with an alarm that treats missing data as breaching:
aws cloudwatch put-metric-data --namespace MyApp --metric-name NightlyExportSucceeded \
  --value 1 --unit Count
Several metrics in one call, with metrics.json:
[
  { "MetricName": "OrdersPlaced", "Value": 118, "Unit": "Count",
    "Dimensions": [{ "Name": "Environment", "Value": "prod" }] },
  { "MetricName": "CheckoutLatency", "Unit": "Milliseconds",
    "Values": [120, 135, 410], "Counts": [50, 30, 2],
    "Dimensions": [{ "Name": "Environment", "Value": "prod" }] }
]
Pre-aggregated statistics instead of raw values:
aws cloudwatch put-metric-data --namespace MyApp --metric-name RequestLatency --unit Milliseconds \
  --statistic-values Sum=15230,Minimum=12,Maximum=980,SampleCount=200
Confirm it arrived (it can take up to 15 minutes to be listed):
aws cloudwatch list-metrics --namespace MyApp --metric-name JobBacklogSecondsOptions that matter
| Option | Notes |
|---|---|
--namespace | Your own name, such as MyApp. Names starting with AWS/ are reserved. |
--unit | Keep it consistent; datapoints with different units are treated as different series in statistics. |
--storage-resolution 1 | High-resolution (per-second) storage, needed for 10 or 30-second alarm periods. Costs more. |
--timestamp | Defaults to now. Points far in the past or future are rejected. |
--dimensions | Each distinct combination creates a new billed metric. |
Gotchas
- Cardinality costs money. Putting user IDs, request IDs or other unbounded values into dimensions creates thousands of custom metrics. For high-cardinality data, use the embedded metric format in logs or Logs Insights.
- One call per datapoint does not scale. Batch with
--metric-data, or publish from code with the SDK, rather than looping the CLI thousands of times. - Values are numbers only; very large or very small values outside CloudWatch's accepted range are rejected.
- Permissions. The caller needs
cloudwatch:PutMetricData; you can restrict it to a namespace with thecloudwatch:namespacecondition key.
Questions
How do I create a custom CloudWatch metric?
There is no separate create step. The first put-metric-data call for a new namespace, name and dimensions creates the metric.
How long until a custom metric appears in CloudWatch?
Datapoints can be read with get-metric-statistics soon after publishing, but a brand-new metric can take up to 15 minutes to show up in list-metrics.
How do I alarm on a custom metric?
Use put-metric-alarm with your namespace, metric name and exactly the same dimensions you publish with.
Custom metrics are often what turns a silent failure into an alert on your phone. CloudConsole, a phone app for AWS, is built to show alarms on custom and AWS metrics alike.
About the app → · Download on the App Store