 CloudConsole
How to tail CloudWatch logs
Run aws logs tail /aws/lambda/my-function --follow to stream new log events to your terminal; add --since 15m to start with recent history and --filter-pattern to show only matching lines. aws logs tail needs AWS CLI version 2. In the console, CloudWatch Live Tail does the same in the browser, streaming events from up to 10 log groups as they arrive.
aws logs tail: the everyday version
# Follow a Lambda function's logs, starting 10 minutes back
aws logs tail /aws/lambda/my-function --follow --since 10m

# Only errors, compact output (no log stream column)
aws logs tail /aws/lambda/my-function --follow --format short \
  --filter-pattern "?ERROR ?Exception ?\"Task timed out\""

# JSON logs: only events whose level field is error
aws logs tail /ecs/orders-api --follow \
  --filter-pattern '{ $.level = "error" }'

# One ECS task's stream
aws logs tail /ecs/orders-api --follow \
--log-stream-name-prefix ecs/orders-api/0abc1234def5678| Option | Effect |
|---|---|
--follow | Keep polling for new events until you press Ctrl+C |
--since | How far back to start: 30s, 10m, 2h, 1d or a timestamp. Default 10 minutes. |
--filter-pattern | CloudWatch Logs filter syntax; terms are case-sensitive |
--format | detailed (default), short or json |
--log-stream-names / --log-stream-name-prefix | Restrict to particular streams |
Live Tail (console and CLI)
Open the CloudWatch console, choose Live Tail under Logs, select one or more log groups, optionally enter a filter pattern, and start. Matching terms are highlighted and you can pause the stream. It's the better choice when you want several log groups interleaved, for example an API function and the worker it calls.
The CLI version streams the same session (log groups are given by ARN, without a trailing :*):
aws logs start-live-tail \
  --log-group-identifiers arn:aws:logs:eu-west-2:123456789012:log-group:/aws/lambda/my-function \
  --log-event-filter-pattern "ERROR"
Live Tail is charged by session time, and sessions end on their own after a few hours; close tabs you aren't watching. aws logs tail uses the regular log-reading APIs instead.
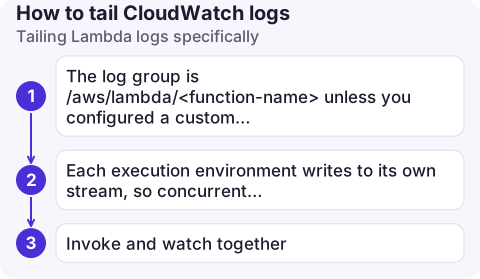
Tailing Lambda logs specifically
- The log group is
/aws/lambda/<function-name>unless you configured a custom log group for the function. - Each execution environment writes to its own stream, so concurrent invocations interleave.
--format shortplus your request ID in log lines keeps it readable. - Invoke and watch together: run
aws logs tail --followin one terminal and aws lambda invoke in another, or useaws lambda invoke --log-type Tailto get the last 4 KB of that invocation's log in the response.
Gotchas
- Nothing appears. Check the Region (
--region), the exact log group name (aws logs describe-log-groups --log-group-name-prefix /aws/lambda/), and that the function or task's role can write logs. - Delay of a few seconds is normal; events are visible shortly after ingestion, not instantly.
- "Invalid choice: tail" means you're on AWS CLI version 1. Upgrade to version 2.
- Throttling when many people tail the same busy group with
--follow; the underlying API has request quotas. Live Tail suits shared debugging sessions better. - Filter patterns are not regex unless you use the regex form inside percent signs; plain terms are literal, case-sensitive matches.
Questions
How do I tail Lambda logs from the AWS CLI?
aws logs tail /aws/lambda/my-function --follow streams new events for that function. Add --since 5m to include the last few minutes.
How do I use a filter pattern with aws logs tail?
Pass --filter-pattern with standard CloudWatch Logs syntax: a term like ERROR, ?ERROR ?WARN for either term, or { $.level = "error" } for JSON logs.
Is CloudWatch Live Tail free?
No. Live Tail is billed by session minutes, with some usage included in the CloudWatch free tier; check current CloudWatch pricing.

Watching logs during an incident is hard on a phone browser. CloudConsole, a phone app for AWS, is built to show the log lines behind an alarm on your phone, readably.
About the app → · Download on the App Store