 CloudConsole
How to troubleshoot high CPU on Amazon RDS
First confirm it's the database engine and not an empty CPU credit balance on a burstable (db.t*) instance. Then find the queries: CloudWatch Database Insights (which replaced the Performance Insights dashboard) shows database load by top SQL and wait event; inside the database, pg_stat_activity (PostgreSQL) or SHOW FULL PROCESSLIST (MySQL) shows what's running now. Fix the worst query or stop it, and only then consider a larger instance.
Step 1: is it real CPU or credits?
aws cloudwatch get-metric-statistics --namespace AWS/RDS \
  --metric-name CPUUtilization --dimensions Name=DBInstanceIdentifier,Value=orders-db \
  --statistics Maximum --period 300 \
  --start-time $(date -u -d '-6 hours' +%FT%TZ) --end-time $(date -u +%FT%TZ) \
  --query 'sort_by(Datapoints,&Timestamp)[].[Timestamp,Maximum]' --output text
On db.t3/db.t4g instances also graph CPUCreditBalance. If credits hit zero in standard mode, the instance is held to its baseline and CPUUtilization can look pinned while queries crawl. That's a sizing problem; unlimited mode or a non-burstable class fixes it.
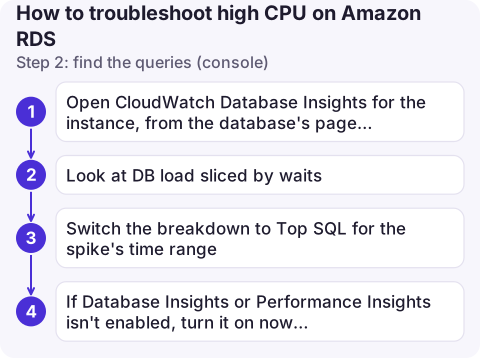
Step 2: find the queries (console)
- Open CloudWatch Database Insights for the instance, from the database's page in the RDS console or from the CloudWatch console. It's where RDS performance analysis now lives.
- Look at DB load sliced by waits: load mostly in
CPUmeans queries burning CPU; IO or lock waits mean a different problem. - Switch the breakdown to Top SQL for the spike's time range. One or two statements usually dominate.
- If Database Insights or Performance Insights isn't enabled, turn it on now (
modify-db-instance --database-insights-mode/--enable-performance-insights) so the next incident has data.
Enhanced Monitoring, if enabled, shows OS process lists, which helps tell database work from other processes.
Step 2: find the queries (SQL)
PostgreSQL:
SELECT pid, now() - query_start AS runtime, state, usename, left(query, 120)
FROM pg_stat_activity
WHERE state <> 'idle' AND pid <> pg_backend_pid()
ORDER BY runtime DESC LIMIT 20;
With the pg_stat_statements extension, ORDER BY total_exec_time DESC shows cumulative heavy hitters.
MySQL / MariaDB:
SHOW FULL PROCESSLIST;
-- or, sorted
SELECT id, user, time, state, left(info, 120) FROM information_schema.processlist
WHERE command <> 'Sleep' ORDER BY time DESC LIMIT 20;
Step 3: fix it
| Finding | Action |
|---|---|
| One runaway query or report | Stop it: see kill a query on RDS |
| A query doing sequential scans | EXPLAIN it; add the missing index, or fix the parameter type mismatch that defeats it |
| Load from a new deploy | Roll back the release; compare Top SQL before and after |
| Many connections each doing a little | Connection storms burn CPU; use RDS Proxy or a pool, and check too many connections |
| Genuinely more traffic | Read replicas for reads, then scale the instance class (brief downtime unless Multi-AZ fails over) |
Common mistakes
- Scaling up first. A bad query plan usually eats a bigger instance too, and the resize itself causes a restart.
- Rebooting to clear it. The same workload returns, now with a cold cache.
- Ignoring autovacuum or long transactions on PostgreSQL: bloat makes every query slower; check for old
idle in transactionsessions.
Questions
How do I find which query is using CPU on RDS?
Use CloudWatch Database Insights (Top SQL by DB load), or query pg_stat_activity on PostgreSQL or SHOW FULL PROCESSLIST on MySQL during the spike.
Why is my RDS t3 instance at 100% CPU?
Possibly it has used its CPU credits and is throttled to baseline. Check the CPUCreditBalance metric.
Should I increase the RDS instance size for high CPU?
Only after ruling out a bad query or missing index. Scaling hides inefficient queries for a while and costs more.

High database CPU usually comes with slow pages and timeouts across the app. CloudConsole, a phone app for AWS, is being built to show RDS metrics and alarms on your phone, so you can see the spike and its timing before you reach a laptop.
About the app → · Download on the App Store