 CloudConsole
How to check RDS logs
In the RDS console open the database, then the Logs & events tab, and view or download a file from the Logs list. From the CLI, list files with aws rds describe-db-log-files and read one with download-db-log-file-portion. For searching and alerting, publish the logs to CloudWatch Logs with modify-db-instance --cloudwatch-logs-export-configuration. Slow query and statement logs are off until you enable them in the DB parameter group.
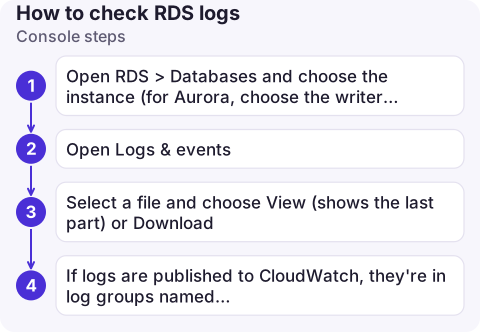
Console steps
- Open RDS > Databases and choose the instance (for Aurora, choose the writer or reader instance, not the cluster).
- Open Logs & events. Recent events shows RDS's own events (failovers, reboots, storage); Logs lists the engine's log files.
- Select a file and choose View (shows the last part) or Download.
- If logs are published to CloudWatch, they're in log groups named
/aws/rds/instance/INSTANCE/LOGTYPE(Aurora:/aws/rds/cluster/CLUSTER/LOGTYPE).
CLI steps
# List log files, newest last
aws rds describe-db-log-files --db-instance-identifier orders-db \
  --query 'DescribeDBLogFiles[-5:].[LogFileName,Size,LastWritten]' --output table

# Read a whole file (the CLI pages through it)
aws rds download-db-log-file-portion --db-instance-identifier orders-db \
  --log-file-name error/postgresql.log.2026-11-17-09 --starting-token 0 --output text > pg.log

# Publish to CloudWatch Logs (PostgreSQL example)
aws rds modify-db-instance --db-instance-identifier orders-db \
  --cloudwatch-logs-export-configuration '{"EnableLogTypes":["postgresql","upgrade"]}' \
  --apply-immediately
MySQL log types are error, general, slowquery and audit; MySQL file names look like error/mysql-error-running.log and slowquery/mysql-slowquery.log. Once in CloudWatch, aws logs tail and Logs Insights work as for any log group.
Turn on the logs you need
| Engine | Parameter (DB parameter group) | Effect |
|---|---|---|
| PostgreSQL | log_min_duration_statement = 1000 | Log statements slower than 1 s |
| PostgreSQL | log_statement = ddl | Log schema changes (all is very noisy) |
| PostgreSQL | log_connections, log_disconnections | Connection auditing |
| MySQL | slow_query_log = 1, long_query_time = 1 | Slow query log |
| MySQL | log_output = FILE | Write general and slow logs to files. The default, TABLE, writes them to mysql.slow_log/mysql.general_log instead, and they won't reach CloudWatch Logs |
You can't edit the default parameter group: create a custom one, attach it, and reboot if the parameter is static. Most logging parameters are dynamic.
Common mistakes
- Looking at the cluster for Aurora logs: files are per instance.
- Expecting history: log files on the instance are rotated and kept for a limited time; publish to CloudWatch Logs and set a retention period to keep them.
- Logging every statement in production: it adds I/O and storage, and can fill local storage. Use duration thresholds.
- Confusing events and logs: "why did my instance restart?" is answered by events (
aws rds describe-events), not the engine log.
Questions
Where are Amazon RDS logs?
On the instance, listed under Logs & events in the RDS console and via aws rds describe-db-log-files. If exported, they're in CloudWatch Logs under /aws/rds/instance/NAME/LOGTYPE.
How do I enable the slow query log on RDS MySQL?
In a custom DB parameter group set slow_query_log to 1, long_query_time to the threshold in seconds and log_output to FILE, then attach the group to the instance.
How do I download an RDS log file with the CLI?
Run aws rds download-db-log-file-portion with the instance identifier, the log file name and --starting-token 0 --output text to fetch the whole file.

Database errors usually show up first as application errors elsewhere. CloudConsole, a phone app for AWS, is being built to show logs and alarms on your phone, so you can check the database side of an incident quickly.
About the app → · Download on the App Store