 CloudConsole
bin() in CloudWatch Logs Insights
bin(period) rounds each event's @timestamp down to the start of a time bucket, so stats count(*) by bin(5m) produces one row per five-minute window. Queries that aggregate by bin() can be shown as a line or bar chart on the Visualization tab and added to a CloudWatch dashboard.
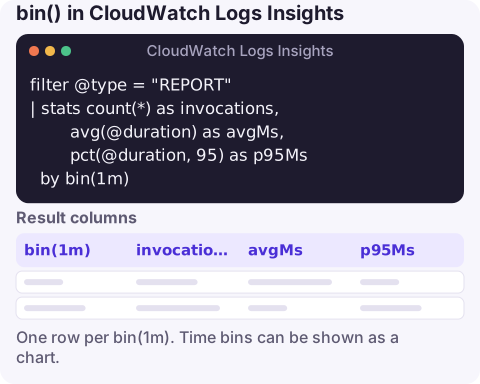
The query
filter @type = "REPORT"
| stats count(*) as invocations,
        avg(@duration) as avgMs,
        pct(@duration, 95) as p95Ms
  by bin(1m)
Pointed at a Lambda function's log group, this gives invocations, average duration and p95 duration per minute: three lines on one chart, all from logs, with no custom metrics needed.
How it works
filter @type = "REPORT"keeps one line per Lambda invocation, the platform summary line, so counts and durations aren't distorted by application logging.stats … by bin(1m)assigns each event to the one-minute bucket its timestamp falls into, then evaluates every aggregate per bucket.- Each aggregate becomes a column, and on the Visualization tab, a series. Name them with
asso the legend is readable.
Buckets with no events produce no row, which shows up as a gap or a straight line between points rather than a zero. Keep that in mind when reading quiet periods.
Choosing a bin size
| Time range | Sensible bin |
|---|---|
| 15–60 minutes | bin(30s) or bin(1m) |
| A few hours | bin(5m) |
| A day | bin(15m) to bin(1h) |
| A week or more | bin(1h) to bin(1d) |
Units include s, m, h and d. Aim for somewhere between about 50 and 300 points across the range: fewer hides short spikes, more makes the line jagged and the table long. When you compare two incidents, use the same bin for both, otherwise a spike that looks twice as tall may just be a bucket twice as wide.
Variations
Errors over time from application logs:
filter level = "ERROR"
| stats count(*) as errors by bin(5m)
Daily totals for a weekly report:
stats sum(bytes) / 1024 / 1024 / 1024 as GiB by bin(1d)Several series from one field. Grouping by a bin and another field returns one row per bucket and value, which reads fine as a table. For a clean multi-line chart, give each series its own aggregate column instead, for example by counting matches with strcontains:
stats sum(strcontains(@message, "WARN")) as warns,
      sum(strcontains(@message, "ERROR")) as errors
  by bin(5m)
From query to dashboard
On the Visualization tab, choose line, stacked area or bar, then Add to dashboard. The widget re-runs the query whenever the dashboard loads or refreshes, and each run is billed for the data scanned, so a widget over many large log groups on an auto-refreshing dashboard can add up. For something you'll watch constantly or alarm on, publish a metric with a metric filter or embedded metric format and chart that instead; keep bin() queries for investigation and occasional reporting.
Questions
What does bin() do in CloudWatch Logs Insights?
It rounds @timestamp down to the start of a bucket of the size you give, such as 5m, so stats by bin(5m) aggregates per five-minute window.
Why doesn't my Logs Insights query show a chart?
Visualisation needs an aggregation with stats, usually grouped by bin(). Plain fields or filter queries only produce a table.
Can I use bin with other group-by fields?
Yes, stats count(*) by bin(5m), status works and returns one row per bucket and status. For a cleaner chart, compute separate aggregate columns instead.
A time series from logs is what you want to glance at when an alarm goes off. CloudConsole, a phone app for AWS, is built to show alarms and the related logs on your phone.
About the app → · Download on the App Store