 CloudConsole
Group by in CloudWatch Logs Insights
Logs Insights has no separate GROUP BY clause; grouping is part of stats. Write stats count(*) by field to get one row per value, add more fields after by for combinations, and use bin(1d) or datefloor(@timestamp, 1d) to group by day.
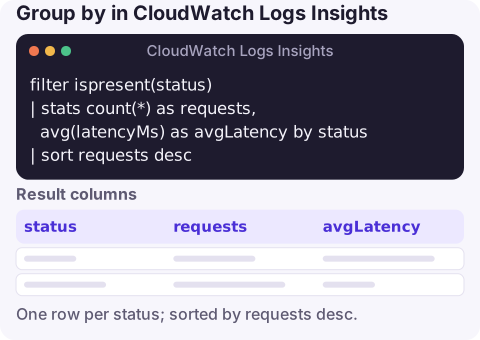
The basic query
filter ispresent(status)
| stats count(*) as requests, avg(latencyMs) as avgLatency by status
| sort requests desc
filter ispresent(status)drops events that don't have the field. Without it, events lackingstatusform their own group with an empty value, which clutters the result.stats … by statusproduces one row per distinct value ofstatus, with every aggregate you list calculated per group. Name each aggregate withasso you can sort on it.sort requests descorders groups by the count. You can sort by any alias or by the grouping field itself.
Grouping by more than one field
List several fields after by, separated by commas. You get one row per combination that actually occurs:
stats count(*) as n by httpMethod, resourcePath, status
| sort n desc
| limit 50
Nested JSON fields use dot notation, exactly as shown in the discovered-fields pane: by detail.eventSource or by userIdentity.arn. Arrays are flattened with an index, so the first element of items is items.0.
You can also group by an expression or a field you created earlier with fields or parse:
parse @message "path=* " as path
| fields tolower(path) as route
| stats count(*) as n by route
Group by hour or day
For time grouping, use bin():
filter level = "ERROR"
| stats count(*) as errors by bin(1d)
Or datefloor, which rounds each timestamp down and can sit alongside other grouping fields:
stats count(*) as logins by datefloor(@timestamp, 1d), userTypeBuckets are based on @timestamp, which is stored in UTC, so a "day" runs midnight to midnight UTC. Keep that in mind when you compare with business reports in a local time zone. For hourly patterns across many days, group by bin(1h) and chart it on the Visualization tab.
Group-by mistakes that cost time
- Grouping by a high-cardinality field such as request ID or timestamp gives one row per event, which hits the 10,000-row cap and tells you nothing. Group by something with tens or hundreds of values.
- Forgetting the alias. Name each aggregate with
asand sort by that name; trying to sort on the raw expression is a common source of syntax errors. - Case differences.
GETandgetare different groups; normalise withtolower(). - Expecting
displayafterstatsto bring back raw fields. Once you aggregate, only the grouping fields and aggregates exist.
Not the same as grouping metrics by dimension
If you want to group CloudWatch metrics (for example CPU per instance), that's CloudWatch Metrics Insights, which uses SQL-like syntax rather than Logs Insights commands:
SELECT AVG(CPUUtilization)
FROM SCHEMA("AWS/EC2", InstanceId)
GROUP BY InstanceId
ORDER BY AVG() DESC
LIMIT 10
Logs Insights groups log events; Metrics Insights groups metric data points. They are separate features with separate query editors.
Questions
How do I group by a field in CloudWatch Logs Insights?
Use stats with by, for example stats count(*) as n by status. Every aggregate in that stats command is calculated per value of the field.
How do I group by day in Logs Insights?
Use stats count(*) by bin(1d), or datefloor(@timestamp, 1d) alongside another grouping field. Days are UTC.
Can I group by multiple fields?
Yes. List them after by, separated by commas: stats count(*) by service, status.
Grouped counts are usually the fastest way to see what changed during an incident. CloudConsole, a phone app for AWS, is built to put alarms and log views on your phone for that first look.
About the app → · Download on the App Store