 CloudConsole
CloudWatch Logs Insights query examples
A Logs Insights query is a pipeline of commands separated by |: usually filter to narrow events, then stats to aggregate or fields to pick columns, then sort and limit. The examples below cover the queries engineers reach for most, each ready to paste into the console with the right log group selected.
Search and filter
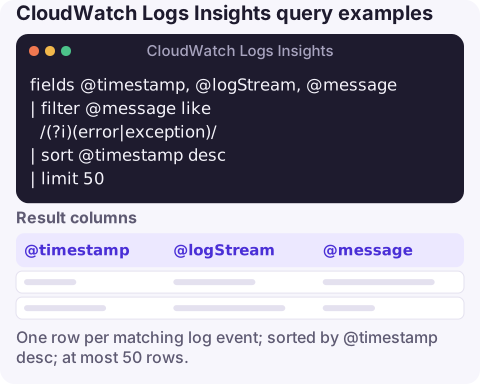
Latest errors, newest first. The (?i) makes the regex case-insensitive:
fields @timestamp, @logStream, @message
| filter @message like /(?i)(error|exception)/
| sort @timestamp desc
| limit 50
Exclude noise. Combine conditions with and, or and not:
fields @timestamp, @message
| filter @message like /ERROR/
  and @message not like /HealthCheck/
| sort @timestamp desc
Exact field match on JSON logs, where Logs Insights has already discovered the fields:
fields @timestamp, level, msg, userId
| filter level = "ERROR" and service in ["checkout", "payments"]
| sort @timestamp desc
| limit 100
Count and group
Errors per 5 minutes, which the console can chart on the Visualization tab:
filter @message like /ERROR/
| stats count(*) as errors by bin(5m)
Top error messages, grouped and sorted by how often they occur:
filter level = "ERROR"
| stats count(*) as n by msg
| sort n desc
| limit 20
Which log stream is noisiest (for Lambda, roughly which execution environment):
stats count(*) as events by @logStream
| sort events desc
| limit 10
Service-specific queries
Lambda: slowest invocations and memory headroom using the fields Logs Insights extracts from REPORT lines:
filter @type = "REPORT"
| fields @requestId, @duration, @maxMemoryUsed / 1000 / 1000 as usedMB, @memorySize / 1000 / 1000 as sizeMB
| sort @duration desc
| limit 20
API Gateway access logs in JSON (field names depend on your log format):
filter status >= 500
| stats count(*) as errors by resourcePath, status
| sort errors desc
VPC Flow Logs: rejected traffic in the default format:
filter action = "REJECT"
| stats count(*) as attempts by srcAddr, dstPort
| sort attempts desc
| limit 25
CloudTrail: who called a destructive API:
filter eventName in ["StopInstances", "TerminateInstances", "DeleteBucket"]
| fields eventTime, eventName, userIdentity.arn, sourceIPAddress
| sort eventTime desc
Making the examples work on your logs
- Select the right log groups first. A query only scans the groups and time range you choose; most empty results are the wrong group or a range that misses the incident.
- Check the discovered fields. The fields pane lists what Logs Insights extracted. If a field you expect is missing, your logs are probably plain text and you need
parse; see parsing JSON fields and regex parse. - Field names are case-sensitive.
Statusandstatusare different fields. - Strings use double quotes in comparisons; regexes go between slashes.
Cost and limits worth knowing
Logs Insights charges by the amount of log data scanned, not by rows returned, so a narrow time range and fewer log groups make queries both faster and cheaper. A query returns at most 10,000 rows; aggregate with stats rather than paging through raw events, or see getting more than 10,000 results. Long-running queries are stopped by a service time limit, so split very wide time ranges. The full command list is in the syntax cheat sheet.
Questions
How do I filter CloudWatch Logs Insights by a string?
Use filter @message like "text" for a case-sensitive substring, or filter @message like /(?i)text/ for a case-insensitive regex.
Can I query several log groups at once?
Yes. Select multiple log groups in the console, or pass several names to aws logs start-query; results are merged and @log shows which group each row came from.
Why does my query return no results?
Usually the time range or log group is wrong, or the field name doesn't match what Logs Insights discovered. Run fields @message | limit 20 to see the raw events first.
A good query is most useful when you can run it the moment an alarm fires. CloudConsole, a phone app for AWS, is built to show alarms and the matching log lines on your phone.
About the app → · Download on the App Store