 CloudConsole
Parse JSON fields in CloudWatch Logs Insights
If each log event is a JSON object, Logs Insights discovers its keys automatically, so you can filter and aggregate on them directly, using dots for nested keys (user.id) and indexes for arrays (items.0.sku). When the JSON is embedded in a text line, extract the values you need with parse, using a glob or a regex.
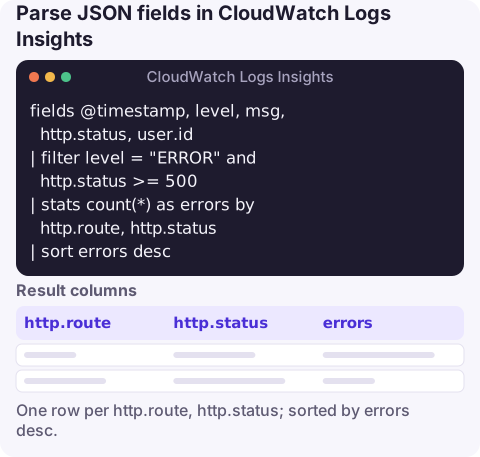
The query: JSON logs, no parsing needed
fields @timestamp, level, msg, http.status, user.id
| filter level = "ERROR" and http.status >= 500
| stats count(*) as errors by http.route, http.status
| sort errors desc
For an event like {"level":"ERROR","msg":"upstream failed","http":{"status":502,"route":"/orders"},"user":{"id":"u-123"}}, Logs Insights creates the fields level, msg, http.status, http.route and user.id. They appear in the discovered-fields pane on the right of the console.
How discovery works
- Nested objects are flattened with dots:
detail.requestParameters.bucketName. - Arrays are flattened with a numeric index: the first element's
skubecomesitems.0.sku. - Numbers stay numbers, so
http.status >= 500andavg(latencyMs)work without conversion. A value logged as a quoted string ("latencyMs":"120") is a string; log numbers unquoted to keep comparisons straightforward. - Odd key names, such as those containing hyphens or spaces, need backticks:
`user-agent`. - Discovery has limits. Only a limited number of fields per event are extracted, so very wide or deeply nested events may not expose every key. If a field is missing from the pane, extract it with
parse.
JSON embedded in a text line
Many logs mix a text prefix with a JSON payload, for example a Lambda line written with console.log or print in the default text format:
2026-11-16T09:12:44.103Z 8f2c6d1e-… INFO {"orderId":"o-981","status":"FAILED","amount":42.5}Extract individual values with a glob pattern, where each * captures text:
filter @message like /"status":"FAILED"/
| parse @message '"orderId":"*"' as orderId
| parse @message '"amount":*}' as amount
| stats count(*) as failures, sum(amount) as value by orderId
Or extract several values at once with a regex and named groups, which is more precise when key order varies:
parse @message /"orderId":"(?<orderId>[^"]+)".*"status":"(?<status>[A-Z]+)"/
| filter status = "FAILED"
| stats count(*) by orderId
The better long-term fix is to log pure JSON. Lambda functions can switch their log format to JSON, after which application fields are discovered automatically.
Parsing timestamps and messages
@timestamp is the event time recorded at ingestion, not a time string inside your message. If your JSON carries its own time, such as "ts":"2026-11-16T09:12:44Z", you can display and sort it as text (ISO 8601 strings sort correctly), but date arithmetic and bin() work on @timestamp. For free-text messages, pull out a readable prefix with substr(msg, 0, 120) and group on that to cluster similar errors, or use pattern msg.
Limits, cost and a common mix-up
Parsing happens at query time, so it doesn't change what you're billed: cost depends on GB scanned. Results cap at 10,000 rows. And if you arrived here from an Unable to parse config file error, that's the AWS CLI failing to read ~/.aws/config, not a log query problem; see unable to parse config file.
Questions
Does CloudWatch Logs Insights parse JSON automatically?
Yes, for log events that are JSON objects. Keys become fields, nested keys use dots and array elements use numeric indexes.
How do I query a nested JSON field in Logs Insights?
Use dot notation exactly as shown in the discovered-fields pane, for example filter detail.status = "FAILED".
How do I parse JSON that's inside a text log line?
Use parse with a glob such as parse @message '"orderId":"*"' as orderId, or a regex with named groups to pull out several values.
Structured logs pay off most when you're debugging away from your desk. CloudConsole, a phone app for AWS, is built to show alarms and log events on your phone.
About the app → · Download on the App Store