 CloudConsole
CloudWatch alarm: ECS HTTPCode_Target_5XX_Count
Alarm on AWS/ECS HTTPCode_Target_5XX_Count per ClusterName and ServiceName using the Sum over 60 seconds, firing when it is above your threshold for 5 of 5 minutes. Start the threshold at about 5% of the service's average requests per minute, taken from the RequestCount metric, then tune it against a few weeks of history.
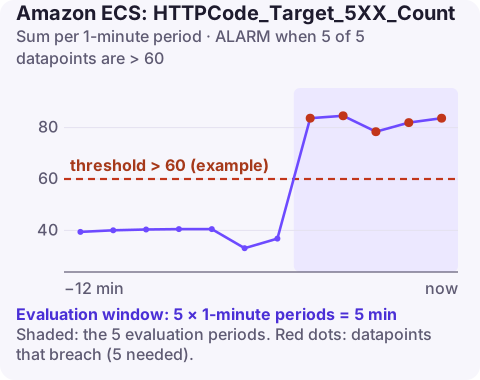
What the metric measures
HTTPCode_Target_5XX_Count counts responses with a 5xx status code that your application returned. In the AWS/ECS namespace, with cluster and service dimensions, ECS publishes it for services that use Service Connect: the proxy running beside each task sees every request and records how the application answered. Check the metric is there before you build on it:
aws cloudwatch list-metrics --namespace AWS/ECS \
  --metric-name HTTPCode_Target_5XX_Count \
  --dimensions Name=ClusterName,Value=prod Name=ServiceName,Value=api
No result means the service does not use Service Connect. A service behind an Application Load Balancer has the equivalent metric in AWS/ApplicationELB, per target group.
Because the count is measured at the application, it reflects errors your code or its dependencies produced: unhandled exceptions, a database that refuses connections, a downstream timeout turned into a 500 or 503. It is a count, not a rate, which is why the threshold depends on how busy the service is.
Recommended alarm settings
| Setting | Recommended value |
|---|---|
| Namespace | AWS/ECS |
| Metric | HTTPCode_Target_5XX_Count |
| Dimensions | ClusterName, ServiceName |
| Statistic | Sum |
| Threshold | Depends on your situation (start at about 5% of average requests per minute) |
| Period | 60 seconds |
| Datapoints to alarm | 5 |
| Evaluation periods | 5 |
| Comparison operator | GreaterThanThreshold |
Working out the threshold
- Get a week of request volume from the
RequestCountmetric for the same service, in hourly sums:aws cloudwatch get-metric-statistics \ --namespace AWS/ECS --metric-name RequestCount \ --dimensions Name=ClusterName,Value=prod Name=ServiceName,Value=api \ --start-time 2026-11-09T00:00:00Z --end-time 2026-11-16T00:00:00Z \ --period 3600 --statistics Sum \ --query 'Datapoints[].Sum' - Convert to requests per minute: add the hourly sums and divide by the number of minutes in the range (10,080 for a week). Say that gives 1,200 requests a minute.
- Take 5%: 60. The alarm then fires after five minutes in which more than 60 requests a minute failed.
- Replay it against history. Chart the one-minute Sum of
HTTPCode_Target_5XX_Countfor the same weeks and check that 60 would have caught the incidents you remember and stayed quiet otherwise.
A fixed count has a weakness: at 3 a.m. the service may handle so few requests that it could fail every single one without reaching 60. If traffic swings widely, alarm on an error rate instead, using metric math (100 * errors / requests) with the --metrics option of put-metric-alarm. Going the other way, a threshold of 1 or 2 on a busy service pages you for every stray error.
Create the alarm
aws cloudwatch put-metric-alarm \
  --alarm-name ecs-prod-api-5xx \
  --alarm-description "api returned more than 60 5xx a minute for 5 minutes" \
  --namespace AWS/ECS \
  --metric-name HTTPCode_Target_5XX_Count \
  --dimensions Name=ClusterName,Value=prod Name=ServiceName,Value=api \
  --statistic Sum \
  --period 60 \
  --evaluation-periods 5 \
  --datapoints-to-alarm 5 \
  --threshold 60 \
  --comparison-operator GreaterThanThreshold \
  --treat-missing-data notBreaching \
  --alarm-actions arn:aws:sns:eu-west-2:123456789012:oncall-alerts
Error counters often have no datapoint in minutes without errors, so treating missing data as not breaching keeps the alarm in OK during quiet spells.
When it fires
- Line it up with deployments. If errors started when a new task definition rolled out, roll back first and investigate after.
- Read the application logs for the failing minutes. A Logs Insights query that counts errors per minute shows whether it is one error repeated or many different ones; see count errors over time.
- Check dependencies. A wall of identical 500s that mention a database, cache or downstream API usually means the dependency is down or out of connections, not that your code changed.
- Check the tasks themselves. Tasks restarting because of memory pressure or crashes produce bursts of errors while they come and go; describe-services events will show replacements.
- Look at latency too. A rise in TargetResponseTime just before the errors suggests timeouts are turning into 5xx.
Questions
Why is there no HTTPCode_Target_5XX_Count metric for my ECS service?
In the AWS/ECS namespace it comes from Service Connect. Services without Service Connect have no such metric there; use the load balancer's target group metric instead.
Should I alarm on a 5xx count or a 5xx rate?
A count is simpler and works for services with steady traffic. For traffic that varies a lot over the day, a percentage built with metric math gives the same sensitivity at peak and at night.
A 5xx alarm is often the first sign of a bad deploy, and rolling back quickly matters more than understanding the bug. CloudConsole, a phone app for AWS, is built to show the alarm, the error graph and the service's recent deployments on your phone.
Did it start after a deploy? What changed? on the app’s alarm screen lists the deploys and configuration changes from the hour before the alarm fired.
About the app → · Download on the App Store