 CloudConsole
CloudWatch alarm for Amazon ECS MemoryReservation
MemoryReservation is the percentage of memory registered by a cluster's EC2 container instances that running tasks have reserved. AWS recommends alarming on the Average for the ClusterName above 80% for 5 of 5 one-minute periods. Memory usually runs out before CPU, so on EC2-backed clusters this is often the first placement warning you get.
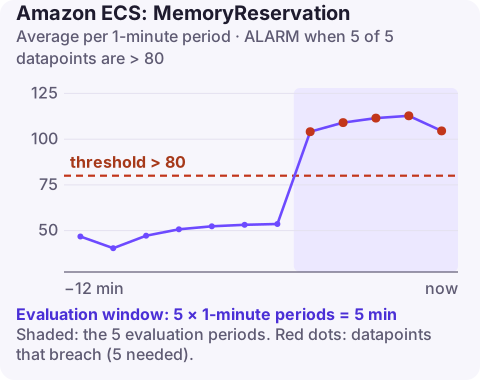
How memory gets reserved
Each container definition can set memory (a hard limit) and memoryReservation (a soft limit). For placement, ECS reserves the soft value if set, otherwise the hard value, and the task-level memory if defined. MemoryReservation sums those reservations for every task on the cluster's container instances and divides by the memory those instances registered.
Unlike CPU, which containers can share when idle, memory is hard to oversubscribe safely, so teams set generous reservations and clusters fill up on memory first. When no instance has enough free memory for a task, the service event log shows a placement failure and new tasks stay pending.
Fargate-only clusters do not use this metric, and AWS does not recommend the alarm when an Auto Scaling group capacity provider with managed scaling is adding instances for you.
Recommended alarm settings
| Setting | Value |
|---|---|
| Namespace | AWS/ECS |
| Metric | MemoryReservation |
| Dimensions | ClusterName |
| Statistic | Average |
| Period | 60 seconds |
| Datapoints to alarm | 5 |
| Evaluation periods | 5 |
| Comparison operator | GreaterThanThreshold |
| Threshold | 80.0 (percent) |
Settings from the CloudWatch recommended alarms list; AWS suggests lowering the threshold to suit the cluster.
Tuning
Work out how much free memory you need to deploy safely: during a rolling deployment the new tasks start before old ones stop, so the largest service temporarily needs extra memory equal to its full set of tasks (with maximumPercent at 200). Express that headroom as a percentage of registered memory and set the threshold below 100 minus that figure. For a cluster with 256 GiB registered and a largest service using 40 GiB, that suggests alarming at about 80%; with one dominant service, lower still.
Create it
aws cloudwatch put-metric-alarm \
  --alarm-name prod-cluster-memory-reservation \
  --namespace AWS/ECS \
  --metric-name MemoryReservation \
  --dimensions Name=ClusterName,Value=prod \
  --statistic Average \
  --period 60 \
  --evaluation-periods 5 \
  --datapoints-to-alarm 5 \
  --threshold 80 \
  --comparison-operator GreaterThanThreshold \
  --alarm-actions arn:aws:sns:eu-west-2:123456789012:ops-alerts \
  --region eu-west-2
When it fires
- Check for pending tasks and placement errors in the service events:
aws ecs describe-services --cluster prod --services api --query "services[0].events[:5]". - Compare reserved with used. If service MemoryUtilization is far below what is reserved, lower
memoryReservationin the task definitions and redeploy; this often frees a lot of room. - Add instances to the Auto Scaling group behind the cluster, or adopt a capacity provider with managed scaling.
- Look for stragglers: stopped services with leftover tasks, or one-off tasks started with
run-taskand never stopped (list-tasks).
Also check the daemon services that run on every instance, such as log or metrics agents: their reservation is multiplied by the instance count and is easy to overlook.
Questions
Does memoryReservation or memory count for ECS MemoryReservation?
For placement, ECS reserves the soft limit (memoryReservation) when set, and the hard limit (memory) otherwise.
Why do ECS clusters run out of memory before CPU?
Memory cannot be shared between idle containers the way CPU can, so reservations are usually set closer to peak needs and fill instances first.
Is MemoryReservation useful on Fargate?
No. Fargate tasks do not reserve memory on your container instances; each task gets its own capacity.
A full cluster tends to surface as a deployment that never finishes. CloudConsole, a phone app for AWS, is built to show this alarm with the service events that explain stuck tasks on a phone.
Did it start after a deploy? What changed? on the app’s alarm screen lists the deploys and configuration changes from the hour before the alarm fired.
About the app → · Download on the App Store