 CloudConsole
How to check ECS service events
Run aws ecs describe-services --cluster CLUSTER --services SERVICE --query 'services[0].events[:20]', or open the service in the ECS console and choose the Events tab. Events are the scheduler's own log: task placements, deployments, health check replacements, scaling and failures to place tasks. Only the most recent events are kept, so forward ECS events to EventBridge if you need history.
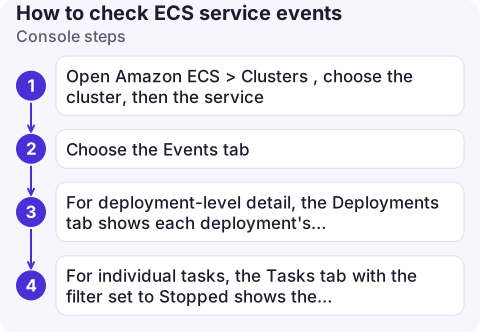
Console steps
- Open Amazon ECS > Clusters, choose the cluster, then the service.
- Choose the Events tab. The newest message is at the top.
- For deployment-level detail, the Deployments tab shows each deployment's rollout state and, for failures, the reason.
- For individual tasks, the Tasks tab with the filter set to Stopped shows the stopped reason per task.
CLI steps
# Latest 20 events, newest first
aws ecs describe-services --cluster prod --services web \
  --query 'services[0].events[:20].[createdAt,message]' --output table

# Only the problems
aws ecs describe-services --cluster prod --services web \
  --query "services[0].events[?contains(message, 'unable') || contains(message, 'unhealthy') || contains(message, 'failed')].[createdAt,message]" \
  --output text

# Deployment state alongside
aws ecs describe-services --cluster prod --services web \
  --query 'services[0].deployments[].[status,rolloutState,rolloutStateReason,desiredCount,runningCount,failedTasks]' --output table
Reading the messages
| Event message (shortened) | Meaning / next step |
|---|---|
has reached a steady state. | Running count matches desired and the deployment is done. Repeats every few hours while healthy |
has started 2 tasks: (task ...) | Normal placement during a deployment or scale-out |
is unable to consistently start tasks successfully | Tasks keep stopping; check stopped task reasons |
was unable to place a task because no container instance met all of its requirements | Capacity or constraint problem; see unable to place a task |
port 8080 is unhealthy in target-group ... | ELB health check failing; see ELB health checks |
deployment failed: tasks failed to start | Circuit breaker tripped; see circuit breaker |
registered 1 targets in (target-group ...) / deregistered | Load balancer attachment changes |
Keep a history
Only the 100 most recent events are shown, and a repeated message is suppressed until its cause is resolved or six hours pass, so you can't scroll back through last week's incident. ECS also emits events to EventBridge (ECS Service Action, ECS Deployment State Change, ECS Task State Change). A rule that sends them to a CloudWatch Logs group gives you a searchable record:
{
  "source": ["aws.ecs"],
  "detail-type": ["ECS Service Action", "ECS Deployment State Change", "ECS Task State Change"]
}
Task state change events include each stopped task's stoppedReason, which disappears from describe-tasks after a short time.
Common mistakes
- Looking at the cluster, not the service. There's no cluster-wide event stream in the console; events are per service.
- Reading old "steady state" lines as current health. Check timestamps; the last steady-state message can be hours old while tasks fail now.
- Missing the stopped tasks. Events say tasks failed; the reason lives on the stopped task, so check both.
Questions
How do I see ECS service events in the CLI?
Run aws ecs describe-services with the cluster and service, and query services[0].events. Events are returned newest first.
How long does ECS keep service events?
Only the 100 most recent events are shown per service. Forward ECS events to EventBridge and CloudWatch Logs for longer history.
Where do I see why an ECS task stopped?
On the stopped task: aws ecs describe-tasks shows stoppedReason and each container's exit code and reason, or use the Tasks tab filtered to Stopped.

Service events are often the fastest explanation for a failing deployment. CloudConsole, a phone app for AWS, is being built to show ECS service events and stopped tasks on your phone, so you can read them without opening a laptop.
About the app → · Download on the App Store