 CloudConsole
How to check Lambda function logs
By default a Lambda function writes to the CloudWatch Logs group /aws/lambda/FUNCTION_NAME, one log stream per execution environment. In the Lambda console choose Monitor > View CloudWatch logs; from the CLI run aws logs tail /aws/lambda/FUNCTION_NAME --since 30m --follow. If the function uses advanced logging controls, check its configured log group instead, and if there are no logs at all, the execution role probably can't write to CloudWatch Logs.
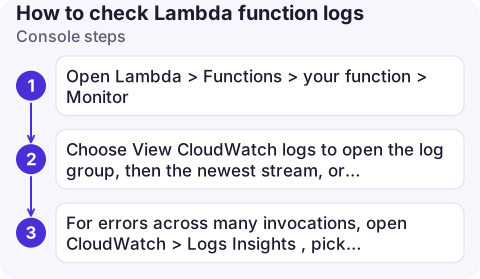
Console steps
- Open Lambda > Functions > your function > Monitor.
- Choose View CloudWatch logs to open the log group, then the newest stream, or use Search log group to search all streams at once.
- For errors across many invocations, open CloudWatch > Logs Insights, pick the log group and run a query (examples below).
Each invocation is framed by START RequestId: ..., your output, END RequestId and a REPORT line with duration, billed duration, memory size and max memory used.
CLI steps
# Which log group does the function use?
aws lambda get-function-configuration --function-name orders-api \
  --query 'LoggingConfig.[LogGroup,LogFormat,ApplicationLogLevel]'

# Recent logs, live
aws logs tail /aws/lambda/orders-api --since 30m --follow --format short

# One request, across all streams
aws logs filter-log-events --log-group-name /aws/lambda/orders-api \
  --filter-pattern '"c0ffee12-3456-7890-abcd-ef1234567890"' \
  --start-time $(date -u -d '-1 hour' +%s)000 \
  --query 'events[].message' --output text
The request ID comes from the caller's error, an API Gateway log or the function's context.aws_request_id. More on tailing in tail CloudWatch logs.
Useful Logs Insights queries
fields @timestamp, @requestId, @message
| filter @message like /ERROR|Task timed out|Runtime\./
| sort @timestamp desc
| limit 50
For timeouts, cold starts and memory, see Lambda timeouts, cold starts and memory usage.
No logs? Check these
| Cause | Check / fix |
|---|---|
| Execution role can't write logs | Role needs logs:CreateLogStream and logs:PutLogEvents (and logs:CreateLogGroup if the group doesn't exist). The managed policy AWSLambdaBasicExecutionRole covers it |
| Custom log group configured | LoggingConfig.LogGroup points somewhere other than /aws/lambda/... |
| Log level filtering | With JSON format and ApplicationLogLevel set to ERROR, your INFO lines are dropped |
| Function never invoked | Check the Invocations metric; the problem is upstream (trigger, permissions, throttling) |
| Wrong Region | Logs are in the function's Region |
| Function invoked at the edge | Lambda@Edge logs go to the Region closest to where it ran, with a us-east-1. prefix in the group name |
Common mistakes
- Opening only the newest stream. Concurrent invocations write to different streams; search the group, not one stream.
- Keeping logs forever. Lambda log groups are created with no expiry; set a retention period, see set log retention.
- Expecting instant logs. Lines can take a few seconds to appear.
Questions
Where are Lambda logs stored?
In CloudWatch Logs, by default in the log group /aws/lambda/FUNCTION_NAME in the function's Region, unless the function's logging configuration names another log group.
Why does my Lambda function have no logs?
Usually the execution role lacks CloudWatch Logs permissions, the function logs to a custom log group, a log level filter drops the lines, or the function was never invoked.
How do I find logs for a specific Lambda request?
Search the log group for the request ID with aws logs filter-log-events or Logs Insights filter @requestId = 'ID'.

Most Lambda incidents start with reading the last few minutes of logs. CloudConsole, a phone app for AWS, is being built to show logs and alarms on your phone, so you can read the error that paged you straight away.
About the app → · Download on the App Store